SWOFF The unrecognized yet indispensable sibling of FMO
IN THIS PAPER YOU WILL |
||
| Find a brief description of FMO controls and their application | See how FMO controls can help to avoid false positive classification of events but fail to prevent false negative classification | Learn how to use the SWOFF approach to prevent false negative classification of events using existing FMO data sets |
The concepts presented herein are not describing a diagnostic use and are for research use only.
Introduction
Multicolor flow cytometry continuously refines our knowledge of cellular phenotypes by steadily increasing the number of simultaneously accessible cellular antigens [1]. This leap in versatility and phenotypic coverage comes with the need to consider a great diversity of fluorochrome-labeled antigen expression patterns combined with differential complex emission characteristics and spillover-spreading patterns. We need to be prepared for overlapping signal intensities between a negative “spreading” background population and dim specifically positive events. Careful antibody panel design and diligent validation is required [2-5].
In response to these requirements, rather determined by fluorochrome characteristics than by nonspecific staining background, isotype control staining has been widely replaced by or combined with fluorescence-minus-one (FMO) control staining: Sequentially each antibody of a given panel is removed once, thus creating a series of control measurements, each with (n-1) antibodies stained for a given panel with n antibodies [6]. Using this method, the upper limit of the negative population for each antibody of interest is revealed, accounting for detector background noise, autofluorescence and spillover-spreading.
FMO controls are widely accepted as the state-of-the-art negative control in flow cytometry. However, FMO prevent only false positive classification of events and cannot reveal dim positive events that are disguised by the spilloverspreading of the negative population. Thus, FMO controls fail to reveal false negative classification of dim positive events that results from improper panel design.
The “switch-off” (SWOFF) model presented here describes an additional, complementary negative control approach. This model reveals both the upper and the lower limit of this “grey zone”, revealing whether positive events are hidden in spillover-associated spreading. SWOFF controls do not require additional staining and can be conducted using FMO data sets. They are essential to verify a given antibody panel can deliver accurate quantification and reveals all populations detectable within a given set of interrogated antigens.
Materials and Methods
2 pairs of 10 Color antibody panels - each pair varying the choice of dye conjugation for identical sets of markers - and respective FMO controls were stained in human peripheral blood. Markers were selected based on their expression on lymphocyte subpopulations including CD3+ T cells and CD3+CD4+ T cells. Thus, different spillover patterns associated with CD3+ or CD3+CD4+ T cells in the different panels were examined to compare the impact of these different spillover patterns on the detection of dimly expressed CD69 on T cells or dimly expressed CD117 on a small subpopulation of CD4+ T cells.
Staining was conducted according to commonly used procedures. In brief, recommended antibody volumes were mixed with 100 µL whole blood (EDTA) and incubated for 15 min at RT in the dark. Erythrocytes were then lysed for 10 min with a 40:1-mixture of Versalyse (Beckman Coulter) and IOTest Fixative solution (Beckman Coulter) and the samples were centrifuged at 300 g for 5 minutes. The supernatant was discarded and the pellet resuspended in 3 mL PBS. After further centrifugation at 300 g and removal of the supernatant the pellet was resuspended in 300 µL PBS and immediately acquired on a Gallios flow cytometer (Beckman Coulter) equipped with 405/488/638 nm lasers and 10 fluorescence detectors (standard filter configuration). Setup of the Gallios flow cytometer was conducted according to the manufacturer’s recommendations.
Data Analysis was done using KALUZA analysis software version 1.5a or higher (For research use only. Not for use in diagnostic procedures) from Beckman Coulter. In brief, files from complete staining and from FMO control staining were merged and events were color-coded according to their identity as completely stained or FMO-stained data sets. Positive-Negative thresholds for selected markers gated on selected populations were determined by overlaying FMO parameters of complete and FMO control staining. In addition, in the case of FMO controls assessing detection limits for brightly expressed and/or discrete antigens overlaid dot plots displaying parameters related to dimly expressed antigens (not containing FMO parameters) were reviewed. As this approach could be interpreted as to “switch off” spillover emissions potentially affecting the detection of dimly expressed antigens it is proposed to call this analysis method “switch-off” or SWOFF analysis.
FMO Staining Controls For Elevated Background But Not For Unfavorable Design
While the FMO control approach prevents potentially false-positive classification of background events it ignores the “grey zone” caused by the spreading that is constituted by both the background population’s upper limit and the lower limit of the dim positive population (figure 1). This “grey zone” will contain negative and dim specifically positive events in an undistinguishable manner, and the FMO control will not reveal this non-discriminative part of the scale [6].
Figure 1

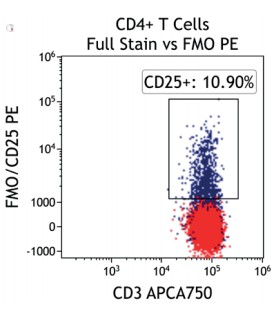
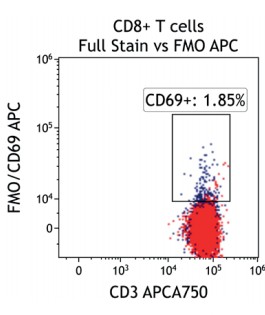
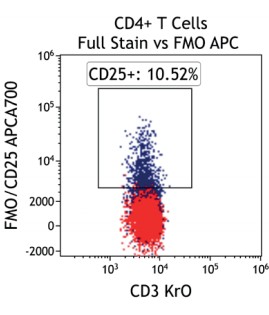
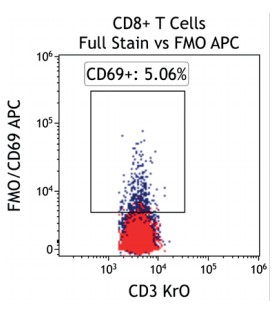
Figure 2 illustrates the significant impact of spillover-spreading on positive %-values that can be obtained using FMO control staining in different dye configurations. For both panel configurations the antibody clones selected are identical while, except for CD69-APC, the fluorochrome conjugation of the clones is different. The values obtained for CD69 expression on T cells differ greatly between both panel configurations despite using identical CD69-APC antibodies. In contrast, the values for CD25 are very similar regardless of the different dyes used with the CD25 antibody clones. We can conclude that the overall panel design and the related spillover-spreading (rather than the brightness of the dyes used for the dim markers) affect the results obtained.
Figure 2.1

|
Figure 2.2 |
Figure 2.3 |
Figure 2.4 |
Figure 2.5
|
SWOFF Analysis Of FMO Data Sets Controls For Lost Sensitivity Due To Unfavorable Design
In order to further understand the implications of the “grey zone” of spillover-spreading and to practically tackle the issue, it is helpful to briefly recapitulate what determines whether or not spreading of a certain background population (in addition to detector background noise [3] and autofluorescence) would be present: a) The fluorochrome characteristics, i.e. their spillover [5], b) the susceptibility of a detector to spillover-spreading, dependent on filtered wavelength range [7,8], and c) antigen expression characteristics and co-expression patterns [9]. a) and b) are physical aspects whose practical consequences depend exclusively on c). The cellular phenotype defines the superimposed emission intensities of the fluorochrome labels attached to a cell. A certain biological phenotype will be associated with a specific spillover-spreading pattern across the array of fluororescence detectors. FMO controls allow to assess this true spillover-spreading background on the label-free detector for each gated phenotype.
The FMO control procedure not only results in the disappearance of the emission of the excluded antibody conjugate on the assigned detector but also in the elimination of its spillover-spreading on the other detectors. Consequently, the same biological phenotype may be associated with different spillover-spreading on a given detector once we apply an FMO control staining and “switch-off” the spreading caused by the excluded fluorochrome on this given detector. Thus, not only we will be able to determine the spillover-spreading background on the current FMOcontrolled detector, we will also be able to compare the background of the FMO control with the background of the complete stain on all other detectors. We will ultimately see whether detection of a dim antigen on any of the detectors in a FMO data set is impacted by “switching off” the spillover of the removed antibody conjugate, suggesting the term of switch-off or SWOFF control.
By conducting SWOFF analysis from all FMO control-stained data sets, we will reveal the lower limit of the positive population for all antigens interrogated in a given antibody panel. We can now identify antibody combinations that are prone to false-low positive values or even completely hiding populations by background spreading. Figure 3 illustrates a scheme of a combined FMO / SWOFF analysis workflow that reveals true background spreading for the detector subjected to FMO and reveals loss of sensitivity related to the excluded fluorochrome on all other detectors.
Figure 3
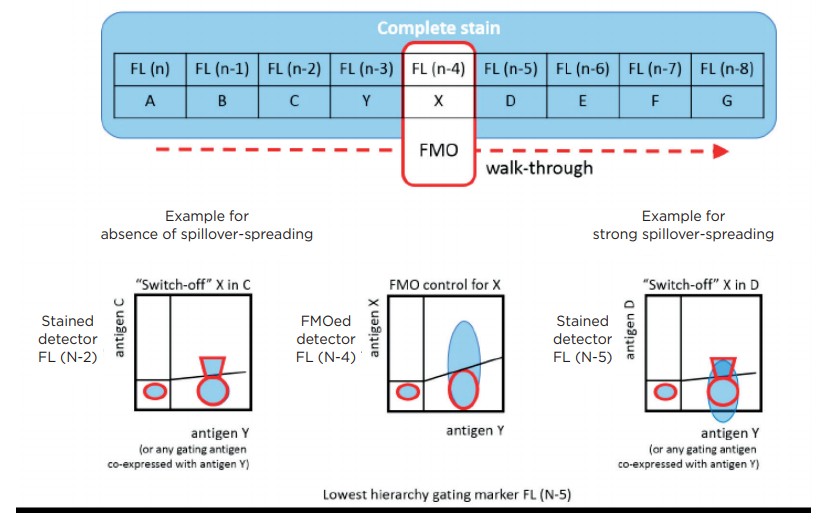
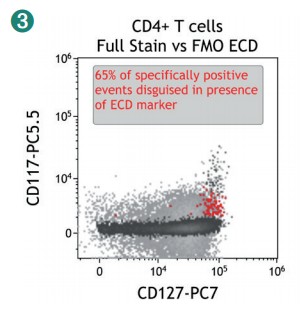
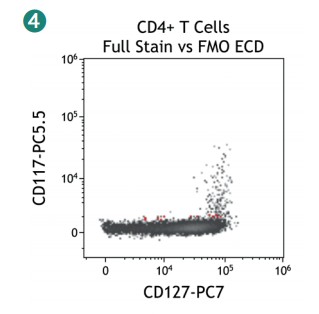
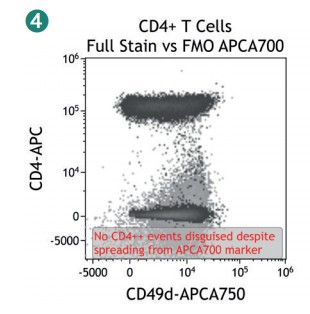
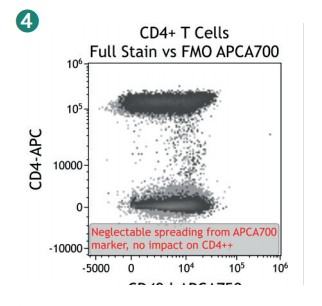
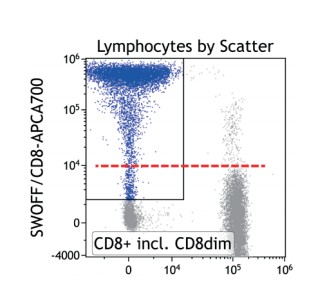
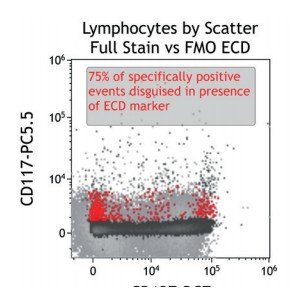
Figure 4 shows how SWOFF analysis discriminates a favorable from an unfavorable choice for the ECD-position in two panel combinations (figure 4.1), allowing for exclusion of the poorly performing combination early during panel validation. While CD45-ECD (panel 3) labeling all leukocytes will also be present on CD4+ T cells and practically disguises the CD4+CD127hiCD117+ population by spillover-spreading as seen in figure 4.2, the T cell-absent CD19- ECD (panel 4) does not compromise the detection of CD4+CD127++CD117+ as seen in figure 4.3. In figure 4.4, SWOFF analysis reveals that despite a strong spreading impact of CD8-APC-A700* on the APC detector in Panel 4, the detection of bimodal CD4-APC is not compromised. Figure 4.5 shows lower spillover-spreading in the APC channels for panel 3, however, this practically does not represent an advantage over panel 4. Figure 4.6 reveals that the exclusive expression characteristics of CD4 vs CD8 on mature T cells enable a gating strategy that circumvents spillover-spreading-related impact on population separation.
Figure 4.1

|
Figure 4.2
|
Figure 4.3
|
Figure 4.4
|
|
Figure 4.5
|
Figure 4.6
|
Figure 4.7
|
Discussion
SWOFF analysis is an economic and informative tool to validate antibody-conjugate choices, while uncovering potential for data interpretation. On one hand, controls in addition to the already numerous FMO control-stained samples is unnecessary and loss of sensitivity for dim antigens can be easily recognized. On the other hand, certain FMO controls will remove population-identifying antibodies and disrupt the gating strategy for the population whose co-expression of a dim antigen is of interest for SWOFF analysis. As a solution for this frequent situation “skipping” of the gating “gap” is suggested, i.e. the gating step involving the excluded antigen is not included in the gating strategy (neither for the FMO data set nor for the complete staining). Therefore, the impact of the omitted antibody will be visible, though related to a population less well defined by the gating hierarchy. Figure 4.7 demonstrates that SWOFF analysis can be conducted even based on mere scatter gating.
The theoretical considerations together with shown examples demonstrate that FMO control staining is necessary but not sufficient to validate correct classification of dim antigens. Any panel design will allow for exclusion of false positive events by the utility of FMO control staining but only panel design preserving sensitivity for dim antigens will pass SWOFF analysis. This “extra-mile control” in method validation ensures the vast majority of dim positive events will not be accidentally missed by an inherently weak experimental design, provided the basic rule of matching fluorochrome brightness with antigen density has been followed.
References
- Perfetto SP, Chattopadhyay PK, Roederer M. Seventeen-colour flow cytometry: Unravelling the immune system. Nat Rev Immunol 2004;4:648–655.
- Nine-color flow cytometry for accurate measurement of T cell subsets and cytokine responses. Part I: Panel design by an empiric approach. McLaughlin BE, Baumgarth N, Bigos M, Roederer M, De Rosa SC, Altman JD, Nixon DF, Ottinger J, Oxford C, Evans TG, Asmuth DM. Cytometry A. 2008 May;73(5):400-10.
- Standardization of whole blood immune phenotype monitoring for clinical trials: panels and methods from the ONE study. Streitz M, Miloud T, Kapinsky M, Reed MR, Magari R, Geissler EK, Hutchinson JA, Vogt K, Schlickeiser S, Kverneland AH, Meisel C, Volk HD, Sawitzki B. Transplant Res. 2013 Oct 25;2(1):17.
- Standardizing Flow Cytometry Immunophenotyping Analysis from the Human ImmunoPhenotyping Consortium. Finak G, Langweiler M, Jaimes M, Malek M, Taghiyar J, Korin Y, Raddassi K, Devine L, Obermoser G, Pekalski ML, Pontikos N, Diaz A, Heck S, Villanova F, Terrazzini N, Kern F, Qian Y, Stanton R, Wang K, Brandes A, Ramey J, Aghaeepour N, Mosmann T, Scheuermann RH, Reed E, Palucka K, Pascual V, Blomberg BB, Nestle F, Nussenblatt RB, Brinkman RR, Gottardo R, Maecker H, McCoy JP. Sci Rep. 2016 Feb 10;6:20686.
- Selecting fluorochrome conjugates for maximum sensitivity. Maecker HT, Frey T, Nomura LE, Trotter J. Cytometry A. 2004 Dec;62(2):169-73. Review.
- Spectral compensation for flow cytometry: visualization artifacts, limitations, and caveats. Roederer M. Cytometry. 2001 Nov 1;45(3):194-205.
- Quantifying spillover spreading for comparing instrument performance and aiding in multicolor panel design. Nguyen R, Perfetto S, Mahnke YD, Chattopadhyay P, Roederer M. Cytometry A. 2013 Mar;83(3):306-15.
- Q and B values are critical measurements required for inter-instrument standardization and development of multicolor flow cytometry staining panels. Perfetto SP, Chattopadhyay PK, Wood J, Nguyen R, Ambrozak D, Hill JP, Roederer M. Cytometry A. 2014 Dec;85(12):1037-48.
