DURAClone IM Granulocytes
Markers
Antigen Density
This table provides expression data on the markers included in the panel for the major blood cell types. This information is a useful aid in panel design and assessing staining results. Fluorochrome to marker combinations were chosen to reduce spillover between channels where the resolution is needed to identify populations. The exact resolution achieved will be a property of these choices along with the capabilities of the instrument used for acquisition.
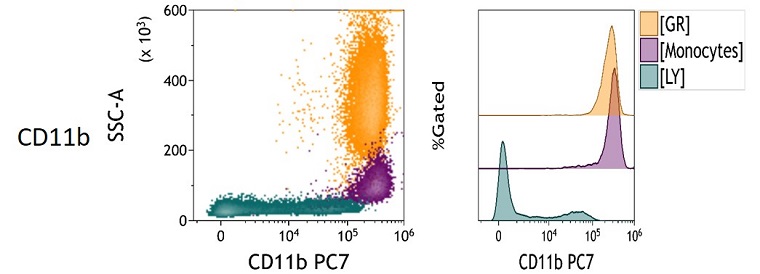
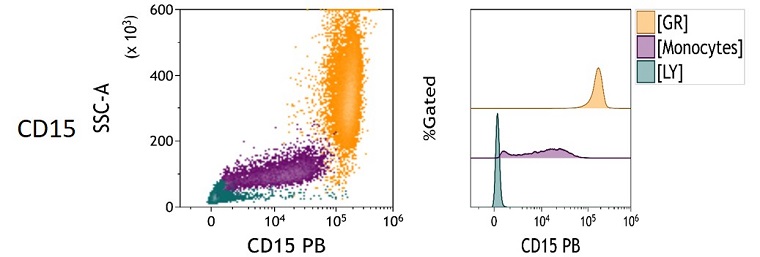
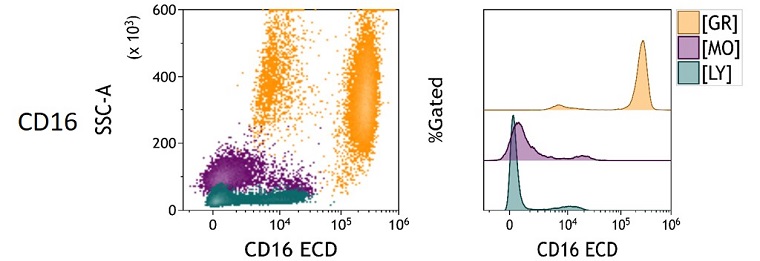
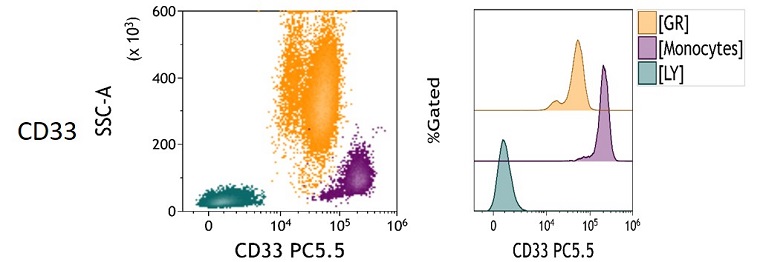
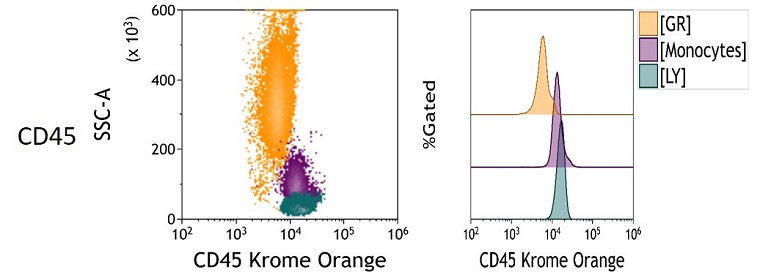
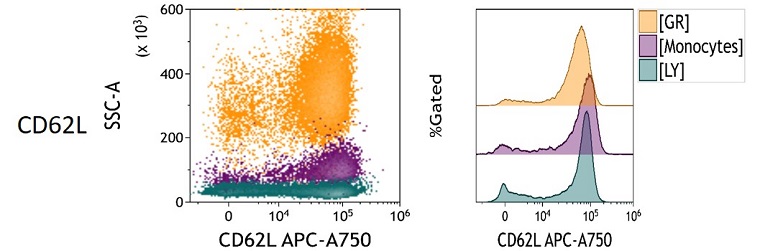
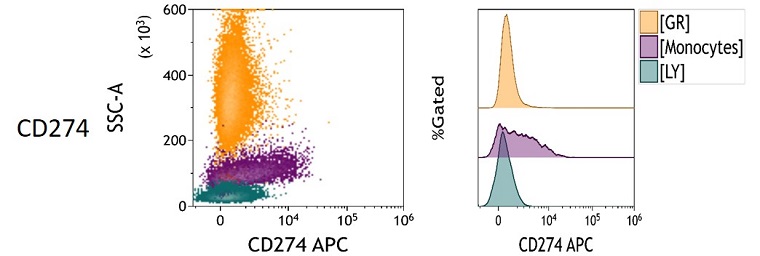
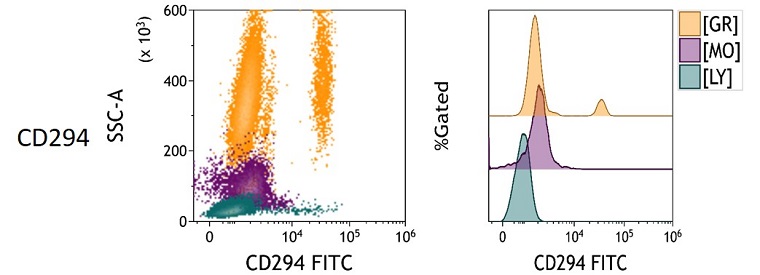
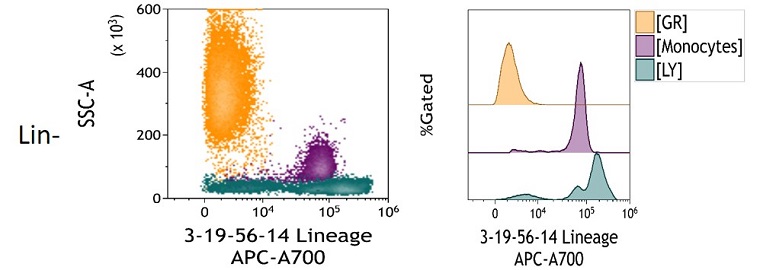
Characterization of Antigen Density. The sample was prepared by staining peripheral blood in a DURAClone IM Granulocytes Antibody Panel (Part Number B88651) following manufacturer’s instructions and acquired on a CytoFLEX LX N-V-B-Y-R-I Flow Cytometer. Data was analyzed using Kaluza Analysis software. Dot plots show SSC x marker staining with lymphocytes in green, monocytes in purple and granulocytes in red. Histograms show antigen expression patterns on the major cell types using the same color coding.
Co-expression Patterns and Spillover Rules
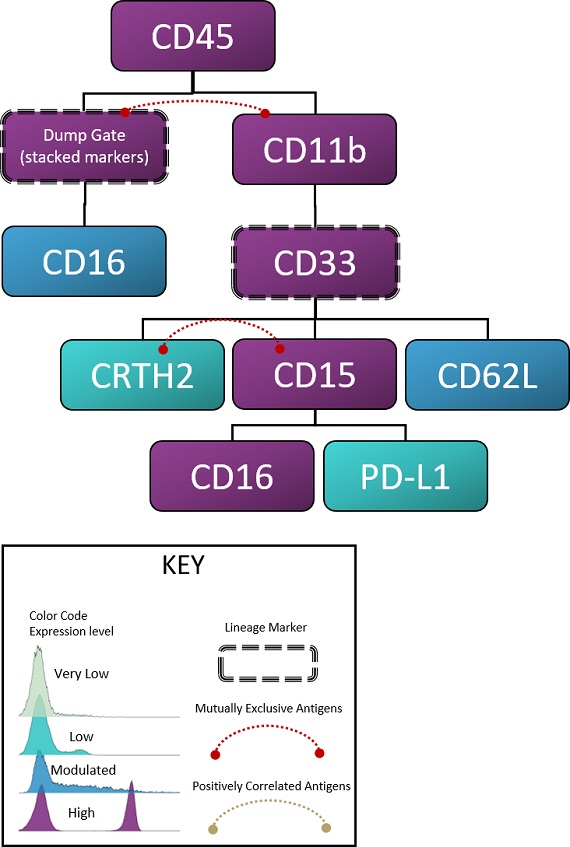
Hierarchical tree structure showing parent-child relationships between the interrogated antigens. Child nodes inherit the properties of the parent nodes above it in the tree. To illustrate, all populations in the analysis will be CD45+, inheriting that property from the parent node. As a principle, spillover from parent to child nodes should be minimized, while spillover from child to parent nodes will not cause a loss of resolution. Nodes at the same hierarchy level without dashed connections are co-expressed antigens whose resolution is impacted by spillover. Colored boxes indicate the expression pattern for the given marker, the lower the expression the more important it will be to avoid spillover from other dyes into that channel. Mutually exclusive antigens in the same level are indicated with a dashed red line. Spillover between these detectors will not cause a loss of resolution as the signals will not be present on the same event. Pairs of antigens that are either double-positive or double-negative are positively correlated antigens that can tolerate spillover, indicated with a dashed gold line.
For Research Use Only. Not for use in diagnostic procedures.
