Characterizing Insulin as a Biopharmaceutical Using Analytical Ultracentrifugation
Content Type: Application Note
Chad Schwartz Ph.D., Dean Clodfelter, M.S. | Beckman Coulter, Inc., Indianapolis, IN 46268
Abstract
Insulin is a well characterized drug used to treat diabetes. A large number of insulin formulations have been investigated in order to develop the optimum time delivery suited to patient needs. In addition, a number of insulin analogs such as Insulin Glargine and LysPro insulin (Humalog) have been developed and marketed as derivatives for immediate use at meal time and a more sustained release. With the regulatory release of a number of guidances on biosimilars, a number of biopharmaceutical companies are actively pursuing versions of these marketed products to address patient needs in this multibillion dollar market. The bioavailability of all these products is strongly dependent on not only the primary structure of the analog but also the formulation. Here, analytical ultracentrifugation (AUC) is investigated as a potential tool to analyze the higher-order structure of insulin under typical formulation conditions. AUC was used to probe the effect of insulin concentration, zinc addition, and the zinc chelating agent EDTA on monomer, dimer, and hexamer formation of USP Human Insulin Reference Standard. The zinc hexamer showed EDTA concentration dependence with increasing dimer and monomer species at higher EDTA concentrations. The methods outlined here highlight the use of the Beckman Coulter ProteomeLab XL-I for characterizing biopharmaceuticals in varying conditions for formulation development.
Introduction
In 2012, 29.1 million Americans, or 9.4% of the population, had either Type 1 or Type 2 Diabetes according to the American Diabetes Association and was the 7th leading cause of death in the United States in 2010 with 69,071 deaths1. The primary treatment for Type 1 diabetes is daily insulin therapy since these patients are incapable of producing enough insulin on their own. Typically, Type I diabetes patients require administering several insulin injections every day at mealtime. However, even when properly administered, insulin injections do not replicate the natural time action profile of insulin, and thus analogs have been developed and are currently in development, to enhance effectiveness. Much of the existing research on the action profile of insulin relies upon the stoichiometry of the molecule in formulation conditions and under dilution conditions after injection into the human body.
Many methods are routinely used by biopharmaceutical companies to measure particle size and heterogeneity in a solution state. AUC functions by defining particle size, heterogeneity, and frictional ratio through manipulation of the Lamm equation which describes particles as they sediment through a liquid under force. AUC has previously been reported to measure the impact of the formulation on the sedimentation coefficient of insulin2,3 but never empirically to assess the impact of zinc and a chelating agent on higher order structure.
Materials
Dibasic sodium phosphate, zinc chloride, EDTA and glycerol were purchased from Fisher Scientific. Sodium hydroxide was purchased from Fluka and hydrochloric acid was purchased from BDH Chemicals. U.S. Pharmacopeia (USP) Human Insulin reference standard was purchased from Fisher Scientific.
ProteomeLab XL I, two-sector sedimentation velocity analytical cells, quartz windows, An 60 Ti rotor, An 50 Ti rotor, and torque stand were all purchased from Beckman Coulter, Inc..
Methods
Non formulated Insulin Concentration Titration: Insulin was resuspended to 50 mg/mL in 0.04 N HCl and diluted to respective concentrations. A reference buffer matching the sample solvent, void of Insulin, was also created. 420 μl of both reference and sample were loaded into a 2 sector analytical cell, aligned with An 60 Ti rotor, and equilibrated at 20˚C for greater than 1 hour. Samples were subsequently spun at 60,000 rpm, 20˚C, 4 hours scanning at Abs280nm in continuous mode.
Formulated Insulin Concentration Titration: Insulin was resuspended to 50 mg/mL in 0.04 N HCl and diluted to respective concentrations and formulated with 150 μM ZnCl2, 16 mg/mL glycerol, 1.9 mg/mL dibasic sodium phosphate, and 2.2 mM NaOH. A reference buffer matching the sample solvent, void of Insulin, was also created. 420 μl of both reference and sample were loaded into a 2 sector analytical cell, aligned with An 60 Ti rotor, and equilibrated at 20˚C for greater than 1 hour. Samples were subsequently spun at 60,000 rpm, 20˚C, 4 hours scanning at Abs280nm in continuous mode.
Zinc Concentration Titration: Insulin was resuspended to 50 mg/mL in 0.04 N HCl and diluted to 4 mg/mL formulated with varying concentrations of ZnCl2, 16 mg/mL glycerol, 1.9 mg/mL dibasic sodium phosphate, and 2.2 mM NaOH. A reference buffer matching the sample solvent, void of Insulin, was also created. 420 μl of both reference and sample were loaded into a 2 sector analytical cell, aligned with An 60 Ti rotor, and equilibrated at 20˚C for greater than 1 hour. Samples were subsequently spun at 60,000 rpm, 20˚C, 4 hours scanning at Abs280nm in continuous mode. The rotor was stopped but left under vacuum at 20˚C. 15 days later, the cells were removed from the rotor, shaken vigorously, and rerun under the same conditions.
EDTA Concentration Titration: Insulin was resuspended to 50 mg/mL in 0.04 N HCl and diluted to 2 mg/mL formulated with 150 μM ZnCl2, 16 mg/mL glycerol, 1.9 mg/mL dibasic sodium phosphate, and 2.2 mM NaOH. Varying concentrations of EDTA were added to the formulated product and incubated for 20 minutes at room temperature. A reference buffer matching the sample solvent, void of Insulin, was also created. 420 μl of both reference and sample were loaded into a 2 sector analytical cell, aligned with An 50 Ti rotor, and equilibrated at 20˚C for greater than 1 hour. Samples were subsequently spun at 50,000 rpm, 20˚C, 5 hours scanning at Abs280nm in continuous mode.
Data Analysis†: Data was extracted from the AUC controller and imported into SEDFIT 14.7 g4 (www. analyticalultracentrifugation.com). Absorbance data were analyzed in terms of a continuous c(s) distribution of sedimenting species using a maximum entropy regularization confidence interval of 0.68. In all cases excellent fits were observed with root mean square deviations ranging from 0.0016 to 0.0093 absorbance units. The partial specific volume of insulin was calculated based on the amino acid composition in SEDNTERP5 (http://sednterp.unh.edu); the density ρ and viscosity η for each formulation buffer were also calculated in SEDNTERP. A c(s) model was used in which the frictional ratio f/fo is floated and the partial specific volume refined. The data was extracted into GUSSI (http://biophysics.swmed.edu/MBR/software.html) and plotted for c(s) with an s value minimum constraint at 0.3S.
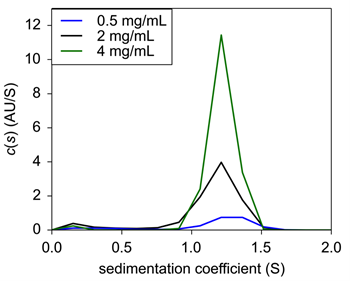 |
| Figure 1: Sedimentation velocity c(s) of Insulin in 0.04N HCl only. |
Results & Discussion
USP Human Insulin was diluted to three different concentrations in 0.04 N HCl and loaded into 2 sector sedimentation velocity AUC cells. Analysis revealed that all three concentrations were centered on 1.2 S through c(s) analysis by the popular software SEDFIT (Fig. 1). The c(s) values were left non normalized to show the change in signal with a decrease in concentration. The obtained value of 1.2 S is most likely representative of monomeric insulin, in agreement with Pohl, et.al.5 and consistent with monomer behavior6,7.
Under typical formulation conditions5, insulin was again sedimented and analyzed for sedimentation coefficient. Here, insulin had a s20,w of between 2.95 – 3.1 S, but at 4.0 mg/mL, a minor species at 2.12 S emerged at a signal weight value of 8.3% of the overall sedimenting material (Fig. 2). This new peak is most likely representative of dimeric insulin. Interestingly, the protein dissociated at the highest concentration, suggesting that assembly is not concentration dependent; rather the dissociation is more likely from nonsaturating conditions of one of the excipients.
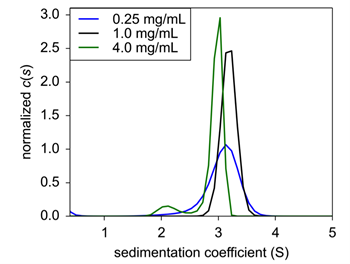 |
| Figure 2: Sedimentation velocity normalized c(s) of concentration titration of formulated Insulin. 0.25 mg/mL (black), 1.0 mg/mL (blue), and 4.0 mg/mL (green) were analyzed for sedimentation coefficient following formulation. |
 |
 |
|
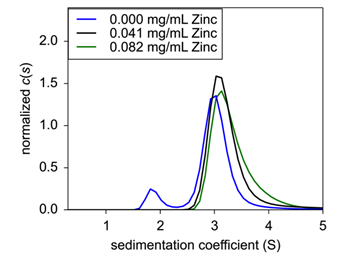
| Figure 3: Sedimentation velocity normalized c(s) of concentration titration of formulated Insulin. 0.25 mg/mL (black), 1.0 mg/mL (blue), and 4.0 mg/mL (green) were analyzed for sedimentation coefficient following formulation. | ||
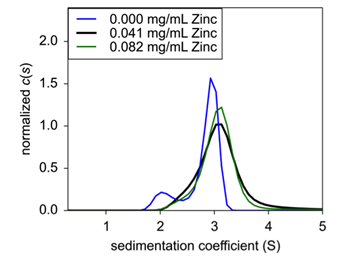
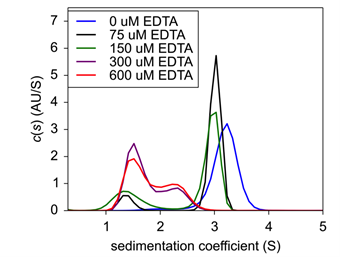
Finally, to confirm zinc’s role in insulin hexamer formation, EDTA was titrated into the formulation to act as a chelating agent. Here, both insulin and zinc concentration were fixed to hexamer stable conditions, and EDTA was then added and incubated for 20 minutes At increasing concentrations of EDTA, hexameric insulin was dissociated into monomer and dimer species (Fig.4). At 75 μM EDTA, approximately 11% of the hexameric complex had dissociated into monomer (Table 1). At 150 μM, an additional 15% had dissociated up to a total monomeric weight signal at 26.4%. At 300 μM, the hexameric species had completely dissolved into approximately 60% monomer and 40% dimer. Finally, at 600 μM, insulin existed at about 68% monomer and 32% dimer.
 |
|
|||||||||||||||||||||||||
| Figure 4: Sedimentation velocity c(s) of EDTA titration with fixed Insulin concentration. | Table 1: Weight signal average of insulin oligomeric species following EDTA treatment. |
Conclusions
Insulin is a well characterized drug created by many different manufacturers worldwide, and has been used to treat diabetes for more than 80 years. Today, large efforts are currently being undertaken by biopharmaceutical companies to create insulin derivatives and novel formulation to improve efficacy, administration methods, and time action profiles. In future development of insulin analogs, the effect of excipients such as zinc will need to be considered on the assembly state of the drug. These effects can be probed by a number of analytical techniques.
Insulin aggregation levels have been traditionally controlled using the Human Insulin monograph SEC method. This method is used to measure insulin covalent aggregates such as the covalent dimers as a result of the condensation reaction of free amines at the N-terminus and/or at free lysines. Addition covalent aggregation can occur through the disruption and reformation of the disulfide links. However, this method can not measure the relative levels of non-covalent aggregates such as insulin hexamer to monomer levels. These non-covalent aggregates are disrupted during the SEC sample preparation and/or analyses procedure. AUC as demonstrated in this application note, is shown to be useful in assessing the level of non-covalent aggregates such as the insulin hexamer. Here, we demonstrated a straight-forward approach to characterize the higher-order structure of a common biopharmaceutical with minimal development. Most higher-order methods, such as SEC, require adulterating the sample through large dilutions and/ or column-matrix interactions that can further alter the aggregation state. Furthermore, although SEC is currently the preferred method for measuring covalent aggregates, the molar mass range of AUC is approximately from a few hundred to 109 daltons, a range that surpasses the typical capability of analytical SEC7. Finally, AUC can generate quantitative information around protein properties including molecular weight, shape, solvation properties8, post-translational modifications9, and conformational fluctuations10 at concentrations approaching 40-50 mg/mL11, which positions the tool as an independent or orthogonal technique to the traditionally-used biopharmaceutical method of SEC to study biosimilarity, aggregation, lot-to-lot comparability, and formulation development7.
†Results generated from the softwares listed in this section are not guaranteed. Please see specific software tools for individual disclaimers.
References
- American Diabetes Association: http://www.diabetes.org/diabetes-basics/statistics/
- Richards, J.P., Stickelmeyer, M.P., Flora, D.B., Chance, R.E., Frank, B.H., DeFelippis, M.R. Self association properties of monomeric insulin analogs under formulation conditions. Pharmaceutical Research. (1998) 15(9): 1434 1441.
- Pohl, R., Hauser, R., Li, M., De Souza, E., Feldstein, R., Seibert, R., Ozhan, K., Kashyap, N., Steiner, S. Ultra rapid absorption of recombinant human insulin induced by zinc chelation and surface charge masking. J Diabetes Science & Technology. (2012) 6(4): 755 763.
- Schuck P. Size distribution analysis of macromolecules by sedimentation velocity ultracentrifugation and Lamm equation modeling. Biophys. J. (2000) 78:1606–19.
- Cole J.L., Lary J W, Moody T P and Laue T M Analytical ultracentrifugation: sedimentation velocity and sedimentation equilibrium. Methods Cell Biol. (2008) 84:143–79.Fredericq E, Neurath H. The interaction of insulin with thiocyanate and other anions. the minimum molecular weight of insulin. J Am Chem Soc. (1950) 72:2684–91.
- Jeffrey P.D., Coates J.H. An equilibrium ultracentrifuge study of the self association of bovine insulin. Biochemistry. (1966) 5(2):489–98.
- Berkowitz, S.A., Philo, J.S. Characterizing Biopharmaceuticals using analytical ultracentrifugation. Biophysical Characterization of Proteins in Developing Pharmaceuticals. (2014) 9:211-260. DOI:10.1016/B978-0-444-59573-7.00009-9.
- Schuck, P. A model for sedimentation in inhomogeneous media. I. Dynamic density gradients from sedimenting co-solutes. Biophys Chem. (2004) 108(1-3):187-200.
- Moores, S.C., Jason, L., Ausio, J. The elusive structural role of ubiquitinated histones. Biochem Cell Biol. (2002) 80(3):311-9.
- Hansen, J.C., Kreider, J.L., Demeler, B., Fletcher, T.M. Analytical ultracentrifugation and agarose gel electrophoresis as tools for studying chromatin folding in solution. Methods. (1997) 12(1):62-72.
- Philo, J.S., Maluf, N.K. New approaches to investigating the self-association and colloidal stability of protein pharmaceuticals at high concentrations. http://www.ap-lab.com/WCBP 2015 poster.pdf.
CENT-1359APP02.16-A
