Minimizing process variability in the manufacturing of bottled drinking water
Introduction
Not all bottled Drinking Waters are created equal. The mere number of differentiated product options is impressive, and with each different product, goes a unique manufacturing and bottling experience. Even with that diversity, the one thing that all can agree on and that is controlling consistency of taste, product quality, and safety are paramount. Enter…the HIAC 8011+ Liquid Particle Counter… This NIST traceable instrument can be effectively employed to monitor critical points within the bottled water process using particle counts to assess variability and further to ensure quality targets are maintained and consistent. No matter the process method (reverse osmosis purification, vapor distillation, or bottling straight from a natural source) utilized, there will be key parameters that need to be analyzed to maintain rigor in the process control. At the end of the day and heedless of the nature of the final product, Particle Counting with the HIAC 8011+ can be an effective and efficient tool for monitoring and detecting product variability within a given Bottled Drinking Water manufacturing process.

The HIAC 8011+ can be used to perform particle count measurements at many critical points throughout the process of producing Bottled Drinking Water. Depending upon the supplier and the nature of their final product, each will have a set of unique metrics or critical process points that can be monitored for particle counts and analyzed to assess repeatability and reproducibility which in turn can demonstrate control of the process and lead to a consistent quality of their finished products.
Process makes perfect…
If the manufacturer employs a type of purification (filtration) on their water, the product can be measured for particle counts to determine the filtration efficiency and consistency of the purification process using the HIAC 8011+ liquid Particle Counter. This can establish a critical and objective pass/fail baseline for this important step. After the purification process, there may be further steps necessary to enhance the taste or drinkability of the water by adding trace amounts of minerals, etc. The output of this step is another point in the process to assess the consistency and repeatability of the product using the HIAC 8011+. Further, after the fill process, analyzing the particle counts again can be used to determine if there are any contribution of contaminants from the actual bottles. Lastly, a final critical piece of the quality process is to evaluate the effectiveness of the material formulation of the bottle itself and its resistance to rough treatment that could occur during typical shipment or normal final product use by the consumer. All things being equal, if there is an obvious count increase after this type of testing it could indicate sloughing or shedding of plastic particles from the bottle itself.
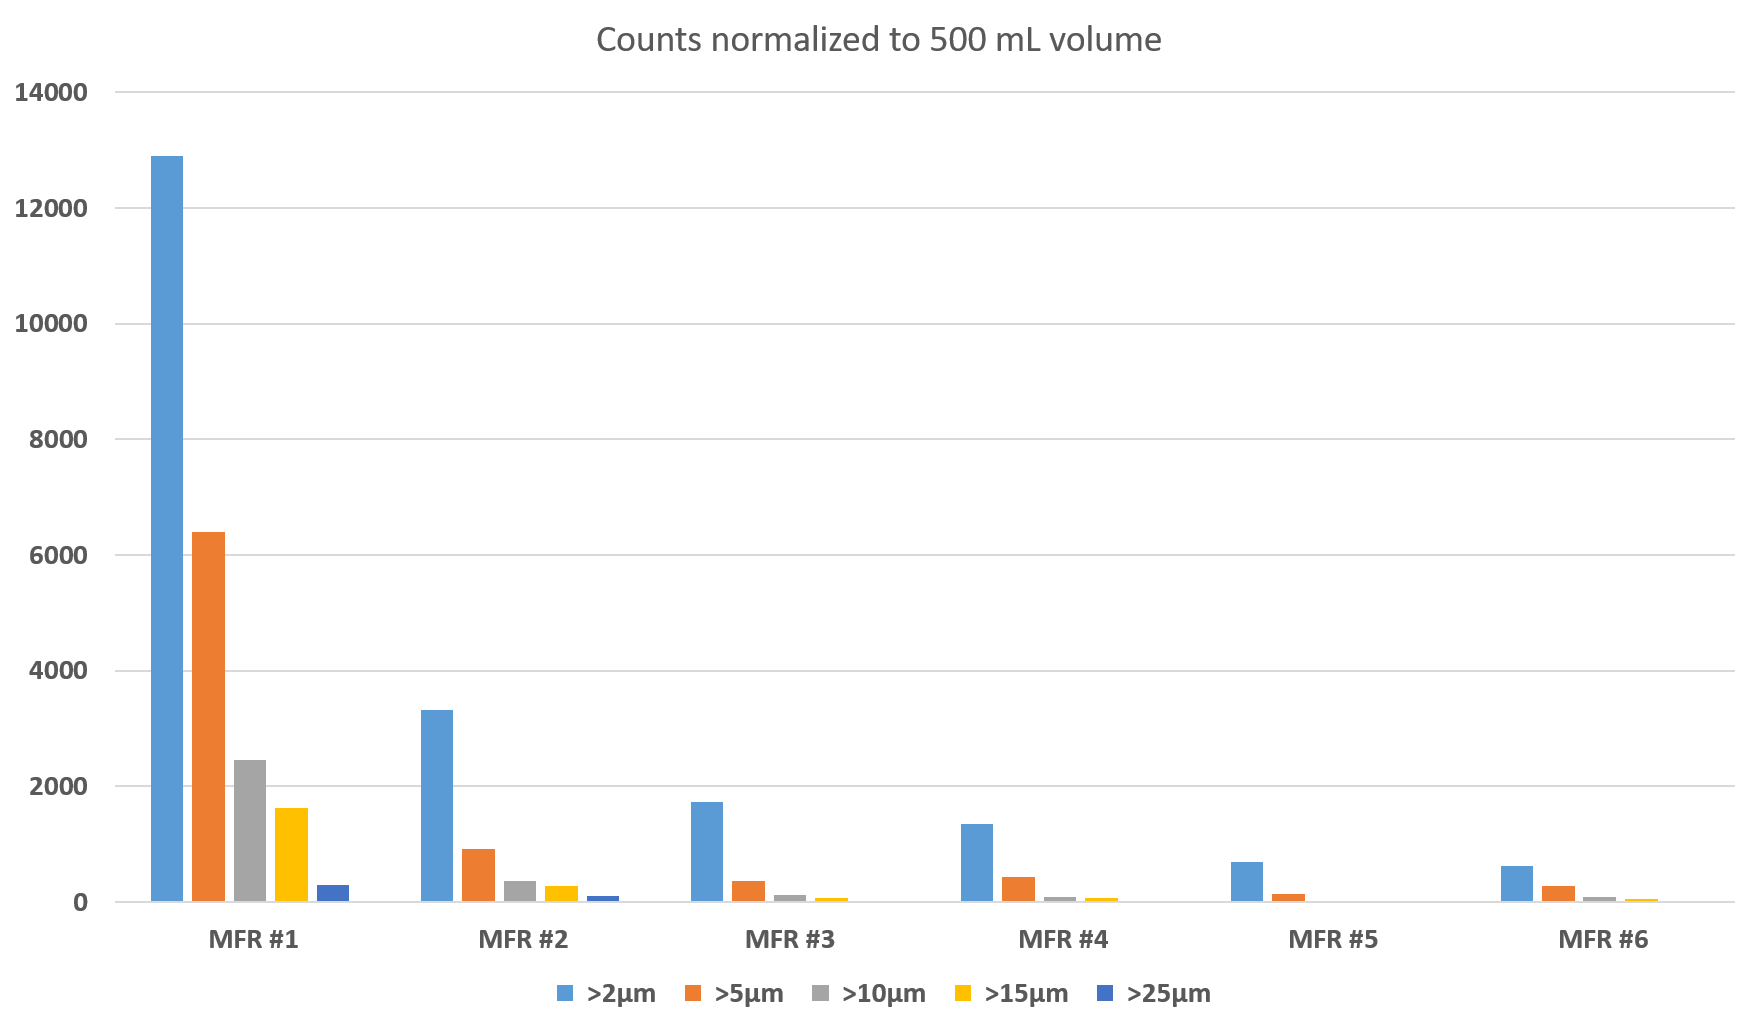
The many offerings within the bottled water community include but are not limited to: waters from natural sources, i.e.; mountain and valley springs, glaciers, and artesian wells, while other manufacturers favor alternative processes such as vapor distillation, reverse osmosis purification (filtration), etc. Through some own local lab testing, we at Beckman Coulter Life Sciences have determined that nearly every suppliers process will yield a different set of Go/NoGo metrics in terms of particle counts. As mentioned previously, this is attributed to the multitude of different products and associated processes. This simply means that every manufacturer can use the HIAC 8011+ as a process tool to optimize and control variability and standardize the process across multiple manufacturing locations and geographies. The following table and graph include 6 different Bottled Water manufacturers. The products were all purchased at the same time from a local grocery market. The purpose of the graphics are to illustrate just how different each product can look in terms of particle counts. The processes used to produce the below products include the following in no particular order: Purification by filtration, vapor distillation, bottling at naturally occurring springs and bottling at an artesian well.
Preparation: Each bottle was put on a rolling mixer for a minimum of 5 minutes
| Size | MANUFACTURERS | |||||
| MFR #1 | MFR #2 | MFR #3 | MFR #4 | MFR #5 | MFR #6 | |
| >2μm | 12905.00 | 3315.00 | 1720.00 | 1350.00 | 685.00 | 625.00 |
| >5μm | 6405.00 | 915.00 | 360.00 | 430.00 | 130.00 | 280.00 |
| >10μm | 2455.00 | 360.00 | 125.00 | 85.00 | 15.00 | 90.00 |
| >15μm | 1630.00 | 270.00 | 75.00 | 60.00 | 10.00 | 55.00 |
| >25μm | 300.00 | 95.00 | 15.00 | 10.00 | 0.00 | 10.00 |
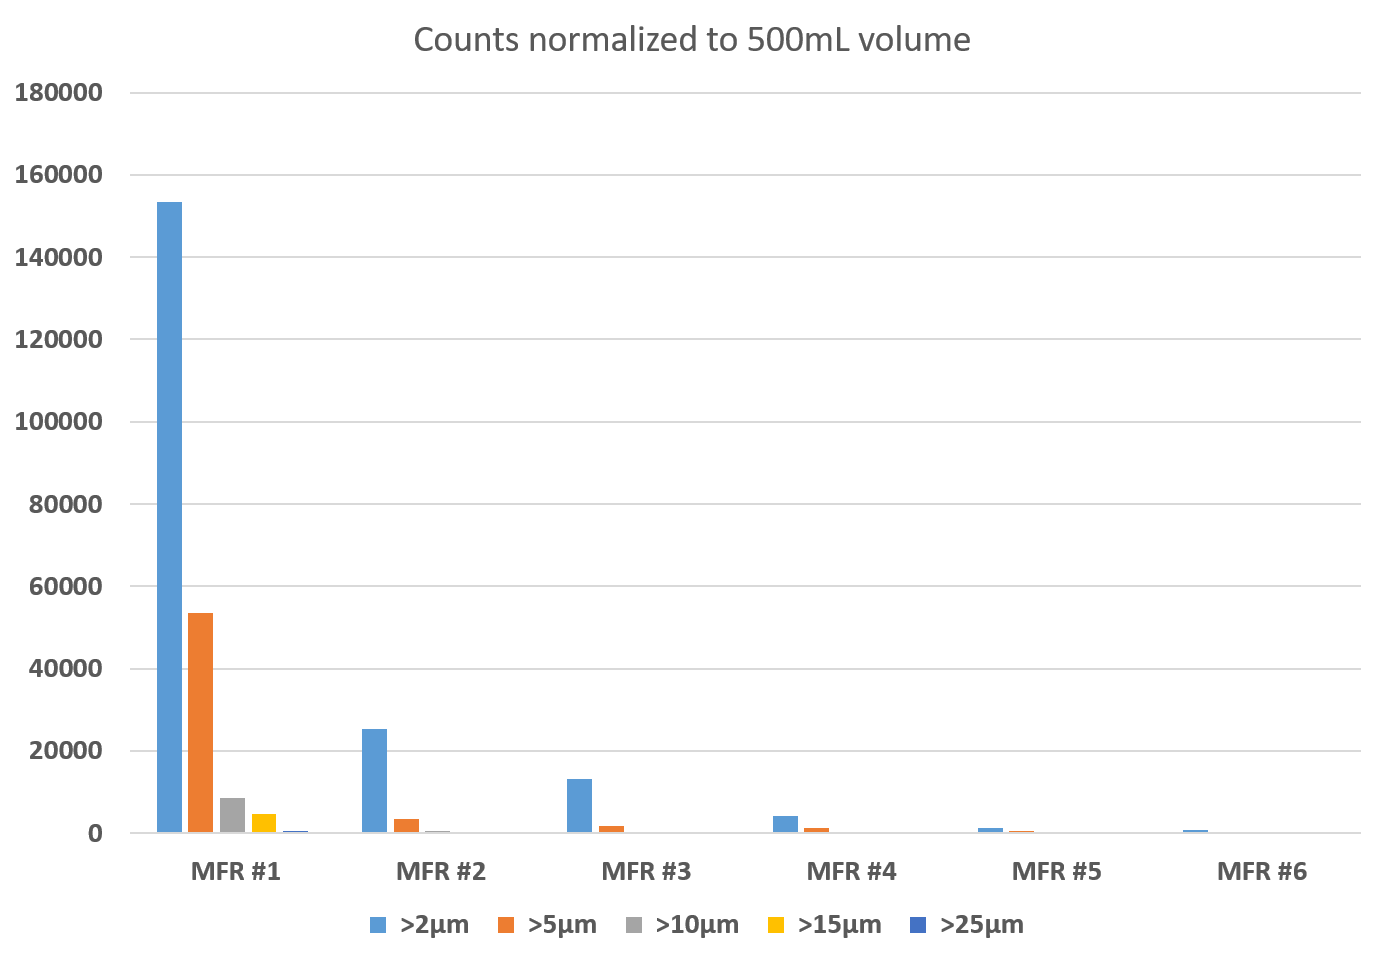
The next chart and graph show the exact same products, but after a one minute aggressive handling step where the bottles were crinkled and dropped multiple times to simulate what can occur during shipment and handling.
It is important to note that each sample was carefully and completely degassed prior to the testing shown below. By comparing the same water bottles before and after the aggressive testing it is obvious where some samples saw a dramatic increase in particle counts and where others showed very minor changes only. This is one example where particle counting demonstrates a tremendous value in that it becomes immediately obvious when a change has occurred and often more importantly when it remains stable.
Preparation: Each bottle was aggressively crinkled by hand and then put on a rolling mixer for a minimum of 5 minutes
| Size in μm | MANUFACTURERS | |||||
| MFR #1 | MFR #2 | MFR #3 | MFR #4 | MFR #5 | MFR #6 | |
| >2μm | 153335.00 | 25405.00 | 13240.00 | 4060.00 | 1190.00 | 870.00 |
| >5μm | 53425.00 | 3530.00 | 1690.00 | 1185.00 | 405.00 | 305.00 |
| >10μm | 8585.00 | 455.00 | 210.00 | 195.00 | 95.00 | 95.00 |
| >15μm | 4720.00 | 320.00 | 130.00 | 130.00 | 40.00 | 70.00 |
| >25μm | 600.00 | 120.00 | 50.00 | 20.00 | 5.00 | 20.00 |
Examples of critical sample points in the process:
- Source Water - Determine a particle count reference baseline. This will be important for measuring process stability and/or variability at critical points within a bottled water manufacturing process.
- After purification (if process is employed) Particle counts can be used to measure filter efficiency and functionality.
- Before bottling, but after all taste and drinkability enhancers are added – Here a new baseline is established as the process has matured further adding components that directly affect flavor quality, stability, and consistency.
- After bottling to ensure the sealing process of capping does not contribute additional contaminants to the product.
- Final QA/QC to ensure the consistency and quality of the final product no matter what facility it was produced at in the world.
Further opportunities and considerations:
- Random testing of products after shipping/rough handling to measure for bottle integrity.
- Perform identical in-process and finished product testing at sister facilities for comparison and analysis to evaluate differences. This technique lends itself well for standardizing like process and leverage best practices.
- Troubleshoot process anomalies quickly and accurately to ascertain the genesis of the problems with near immediate feedback when corrections are introduced.
The HIAC 8011+ is the clear choice
There are a host of reasons the HIAC 8011+ is a prime candidate for this type of process tool The HIAC 8011+ includes a 14 point Sensor calibration using NIST traceable spheres in water. Multiple sensors are available to choose from depending on particle size range and flow rate needs. Features customizable reporting standards to reports counts for up to 18 different channel sizes. Includes a vacuum degassing feature that can be enabled prior to sampling for walk away testing. Employs a pressurized (up to 90 PSI) sample chamber to compress any entrained air bubbles that could lead to count errors. Pressure chamber large enough to accommodate a wide variety of different host bottle sizes. Web Server feature allows remote access to the data Sales and Service available globally.
About the Author

Bill F. Bars is a Sr. Applications Scientist for the Beckman Coulter Particle Counting and Characterization organization. He has created and developed many of the liquid systems production processes for the HIAC products. These include but are not limited to the: 8011+, PODS+, ROC, and HRLD Sensors. He has been in the Particle Counting Industry for 22+ years in a multitude of engineering and technical capacities ranging from Metrology to Customer Service, Technical Training and Applications Support. He is a member of the NFPA U.S. TAG to ISO/TC 131/SC 6 - Contamination control group.
