Temperature dependence of hydrodynamic radius of an intrinsically disordered protein measured in the Optima AUC analytical ultracentrifuge.
Content Type: Application Note
Lance R. English | Department of Chemistry and Biochemistry, Texas State University, San Marcos, Texas, USA
Aysha Demeler | Department of Chemistry, Bergische Universität Wuppertal, Wuppertal, North Rhine-Westphalia, Germany
Steven T. Whitten | Department of Chemistry and Biochemistry, Texas State University, San Marcos, Texas, USA
Borries Demeler | Department of Biochemistry and Structural Biology, University of Texas Health San Antonio, San Antonio, Texas, USA
Abstract
Analytical ultracentrifugation experiments over a wide range of temperatures were conducted to measure the hydrodynamic radius of an intrinsically disordered protein. Taking advantage of the highly stable temperature control offered through the latest shroud modification available in the new Optima AUC, replicate experiments demonstrated highly reproducible hydrodynamic parameters that suggest slight changes in the hydrodynamic radius of an intrinsically disordered protein, and impressive performance in both temperature control and data quality from the Optima AUC. Extensive data analysis with UltraScan 4.0 identified small amounts of contaminants in the protein preparation, and provided statistical validation of the experimental results through global fitting and Monte Carlo analysis. In addition to the sedimentation and diffusion coefficients, partial specific volume, hydrodynamic radius, frictional ratio and frictional coefficients were determined.
Introduction
A reversed-sequence construct of staphylococcal nuclease (retro-nuclease) represents a protein sequence without intrinsic structure or function,1 and was used in this study as a model system for an intrinsically disordered protein. Hydrophobic collapse was not observed and retro-nuclease structure resembles that of biological intrinsically disordered proteins. To assess the degree of disorder, the hydrodynamic radius can be measured with techniques that yield the diffusion coefficient, which is inversely proportional to the frictional coefficient of the molecule, and the hydrodynamic radius. Such techniques include dynamic light scattering, field-flow fractionation, fluorescence correlation spectroscopy, and analytical ultracentrifugation. Here, the hydrodynamic radii of the retro-nuclease protein were measured by analytical ultracentrifugation (AUC) and sedimentation velocity (SV) experiments as a function of temperature. The recent arrival of the Beckman-Coulter Optima AUC analytical ultracentrifuge offers significant technological enhancements over its predecessor, the Beckman-Coulter Proteomelab XLA/XLI model. These enhancements include higher radial precision and resolution, faster scan rates, a very precise monochromator, and with a recent upgrade to the internal chamber shroud, superbly stable temperature control. We show how these technical improvements can be exploited by SV experiments performed in the Optima AUC in conjunction with UltraScan data analysis to obtain highly reproducible results to accurately measure even small changes in hydrodynamic radius as a function of temperature changes.
SV experiments measure the sedimentation coefficient, s, and the diffusion coefficient, D, of a solute in solution by monitoring these two transport processes in a centrifugal force field.
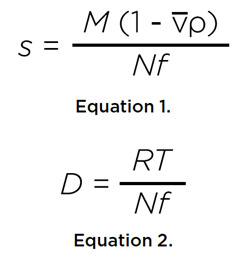
where M is the molar mass of the solute, v its partial specific volume, ρ the density of the solvent, R is the universal gas constant, and T is the temperature in Kelvin, and N is Avogadro’s number. Both coefficients are inversely proportional to the frictional coefficient, f, of the solute, which relates to the hydrodynamic radius rh of the solute via the Stokes-Einstein relationship:
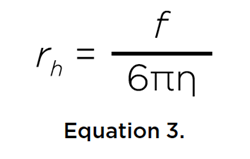
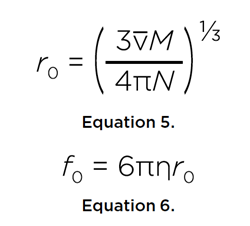
where η is the viscosity of the solvent. Furthermore, if the molar mass of the solute is known, either by sequence or by mass spectrometry, the partial specific volume of the solute can be estimated from these two transport properties:
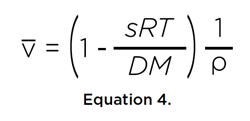
If the solute were a perfect sphere with the same volume, we can derive the radius, r0, and frictional coefficient, f0, of the minimal sphere:
This provides the frictional ratio, or anisotropy, f/f0, of the solute. An anisotropy of 1.0 would indicate a perfect sphere, while an intrinsically disordered protein would be expected to have an anisotropy between 1.5-2.5.
Methods
Experimental
The absorbance of a stock solution of the retro-nuclease protein was adjusted to an optical density of 0.6 absorbance units at 230 nm by dilution with 10 mM phosphate buffer, pH 7.0, containing 100 mM NaCl. Replicate samples were measured by loading both sectors of standard 2-sector epon centerpieces (Beckman-Coulter). All experiments were performed at 50,000 rpm after a 1 hour rotor temperature equilibration at rest, temperatures were set to 4, 12, 20, 28, and 37°C, data were collected by UV intensity detection at 230 nm. Sedimentation experiments were conducted for at least 800 minutes, or until 1,500 scans were collected, by scanning each sector every 20 seconds in a Beckman-Coulter Optima AUC analytical ultracentrifuge at the Center for Analytical Ultracentrifugation of Macromolecular Assemblies at the University of Texas Health Science Center at San Antonio, using an An60Ti rotor. All data were analyzed with UltraScan- III ver. 4.0, release 2420.2, 3 Hydrodynamic corrections for buffer density and viscosity were estimated by UltraScan to be 1.00362 g/ml and 1.00866 cP at 20°C. Viscosity and density adjustments for solvent temperature were automatically made by UltraScan based on the work by Kell.4 Sedimentation and diffusion transport in the ultracentrifugation cell are described by the Lamm equation, which can be solved using adaptive finite element methods5, 6 (ASTFEM). Data from 1,500 scans obtained from each sector in the SV experiment were fitted by linear combinations of ASTFEM solutions using advanced optimization routines 7, 8, 9 that are implemented on a supercomputer.10 For the retro nuclease protein we obtained the molar mass from sequence (16.819 kDa), and used this value for the calculation of hydrodynamic parameters other than s, D, and RhData Analysis
Experimental SV data were pre-processed by 2-dimensional spectrum analysis (2DSA)7 with simultaneously removal of time- and radially-invariant noise contributions11 for s-value ranges from 0.5-5 s and frictional ratio ranges from 1-4. Next, using the same ranges, the meniscus position was fitted as described in.12 The resulting data were further refined by parsimonious regularization using genetic algorithms.8 To obtain error statistics, Monte Carlo analysis was coupled with genetic algorithms in the final refinement.9 Monte Carlo results from duplicate samples were combined and weight-averaged. The calculations are computationally intensive and are carried out on high-performance computing platforms.11 All calculations were performed on the Lonestar-5 cluster at the Texas Advanced Computing Center at the University of Texas at Austin and on Comet at the San Diego Supercomputing Center.
Results
All experiments showed a very high degree of reproducibility (see Figure 1 for an example at 20°C), with narrow 95% confidence intervals (= 2σ, see Figure 2). The Optima AUC exhibited a remarkably high temperature stability at all temperature settings between 4°C – 37°C as judged from the time-state trace recorded in the Optima AUC with 1 second increments (Figure 3), with a fluctuation of approximately ± 0.1°C, except in the early part of the experiment where the adiabatic rotor stretch cooling is visible, causing an -0.6°C cooling effect when accelerating from rest to 50,000 rpm in an AN60Ti rotor. But temperature control logic rapidly returns the temperature back to set values in all cases, with a maximum 0.2°C overshoot (0.3°C at 4°C) that is dampened to set values within the first 20-40 minutes of the experiment.
Hydrodynamic parameters obtained from the velocity experiments performed between 4°C – 37°C indicated only a slight change for all values (see Figure 3 and Table 1). The hydrodynamic radius, rh, appears to see a slight increase as temperature increases, suggesting more unfolding at higher temperatures, or a more flexible molecule that can inhabit additional conformational space. The partial specific volume showed an opposite and consistent drift to lower values with higher temperatures, suggesting less hydration at higher temperatures, possibly due to unfolding, exposing hydrophobic regions in the molecule. Together, the hydrodynamic radius and the partial specific volume contribute to a slight increase in the anisotropy with increasing temperatures, with frictional ratios increasing from 1.96 to 2.11. In summary, these results demonstrate that the Optima AUC produces very stable temperature control and provides highly reproducible answers, allowing researchers to detect even subtle changes in the hydrodynamic parameters of a small intrinsically disordered protein.
| T (°C) | s (s x 10-13) | D (cm2/s x 10-7) | rh (nm) | f/f0 | v (ml/g) |
| 37 | 1.29 (1.27, 1.31) | 6.52 (5.96, 7.07) | 3.48 (3.21, 3.80) | 2.08 (1.90, 2.30) | 0.6973 (0.6743, 0.7166) |
| 28 | 1.23 (1.18, 1.28) | 6.26 (6.02, 6.50) | 3.52 (3.39, 3.66) | 2.10 (2.01, 2.18) | 0.7087 (0.7086, 0.7088) |
| 20 | 1.28 (1.02, 1.55) | 6.25 (4.85, 7.65) | 3.43 (2.80, 4.42) | 2.04 (1.67, 2.65) | 0.7037 (0.6967, 0.7081) |
| 12 | 1.27 (1.24, 1.30) | 6.28 (5.38, 7.18) | 3.31 (2.90, 3.87) | 1.97 (1.70, 2.34) | 0.7162 (0.6770, 0.7457) |
| 4 | 1.22 (1.11, 1.34) | 6.10 (5.24, 6.56) | 3.32 (3.04, 3.66) | 1.96 (1.95, 1.98) | 0.7264 (0.7252, 0.7274) |
| Table 1: Hydrodynamic results for SV measurements or retro nuclease at temperatures ranging from 4 – 37 °C. Values in parentheses represent 95 % confidence ranges obtained in the Monte Carlo analysis (2 σ). | |||||
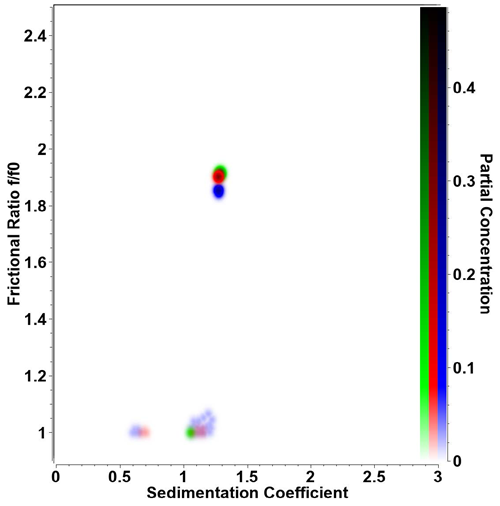 |
| Figure 1.Overlay of pseudo-3D plot for triplicate retro-nuclease samples measured at 20°C. Remarkably high reproducibility is obtained on the Optima AUC for both sedimentation coefficient and frictional ratio for independent experiments. Even low concentration contaminants (s ≈ 0.65s and s ≈ 1.1s) are reproducibly detected at the same position in the 2-dimensional parameter space. Color intensity reflects partial concentration. |
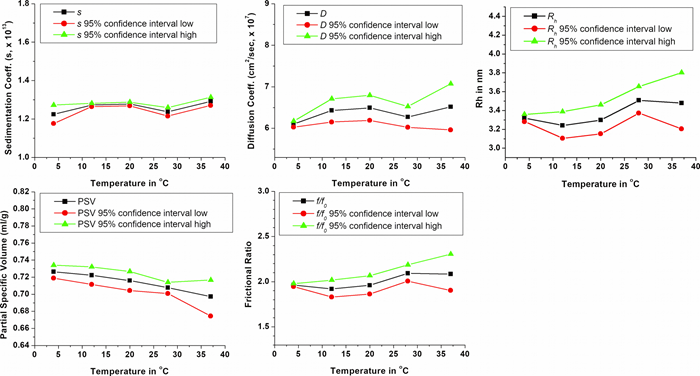 |
| Figure 2. Hydrodynamic parameters obtained from the genetic algorithm – Monte Carlo analysis results from the overlay of duplicate samples at 4, 12, 20, 28 and 37 °C |
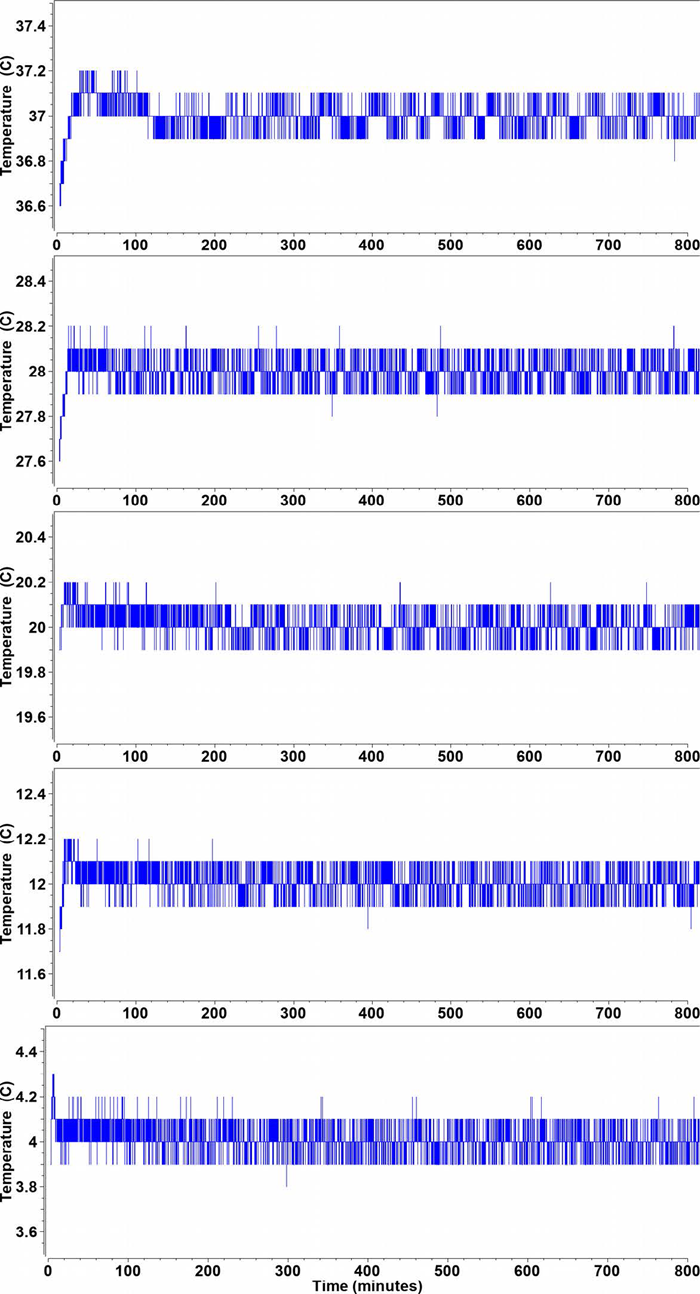 |
| Figure 3. Temperature profiles from the Optima AUC time state for the first 800 minutes from each experiment at a different temperature ranging from 4-37°C. Except a brief adiabatic cooling period during the rotor stretch, the temperature varies for rarely more than +/- 0.1°C at any temperature. Ambient temperature was 24°C.. |
Acknowledgements
BD acknowledges support from the National Science Foundation grant NSF-ACI-1339649 and NIH grant GM-120600 for the UltraScan Science Gateway and UltraScan software development. This study was further supported by Beckman-Coulter. Supercomputer time allocations were provided through National Science Foundation grant TG-MCB070039 (to BD). We acknowledge the support of the San Antonio Cancer Institute grant P30 CA054174 for support of the Center for Analytical Ultracentrifugation of Macromolecular Assemblies at the University of Texas Health Science Center at San Antonio.
References
- English LR, Tischer A, Demeler A, Demeler B, Auton M, and ST Whitten. Conformational bias in disordered proteins correlates with mean hydrodynamic size. (submitted)
- Demeler B, Gorbet G, Zollars D, Dubbs B, Brookes E, Cao W. (2016) UltraScan-III version 3.5: A comprehensive data analysis software package for analytical ultracentrifugation experiments. http://www.ultrascan3.uthscsa.edu/.
- Demeler B., and G. Gorbet. Analytical Ultracentrifugation Data Analysis with UltraScan-III. Analytical Ultracentrifugation: Instrumentation, Software, and Applications. Eds: Uchiyama S., Stafford W. F. and T. Laue, Springer. 2016, Ch 8,119-143
- Kell, SG. Density, thermal expansivity, and compressibility of liquid water from 0.deg. to 150.deg.. Correlations and tables for atmospheric pressure and saturation reviewed and expressed on 1968 temperature scale. J. Chem. Eng. Data, 1975, 20 (1), pp 97–105
- Cao W. and B. Demeler. Modeling analytical ultracentrifugation experiments with an adaptive space-time finite element solution of the Lamm equation. (2005) Biophys J. 89(3):1589-602.
- Cao, W and B. Demeler. Modeling Analytical Ultracentrifugation Experiments with an Adaptive Space-Time Finite Element Solution for Multi-Component Reacting Systems. Biophys. J. (2008) 95(1):54-65
- Brookes, E. H., Cao W., and Demeler, B. (2010). A two-dimensional spectrum analysis for sedimentation velocity experiments of mixtures with heterogeneity in molecular weight and shape. Eur. Biophys. J. 39:405-414.
- Brookes, E. H. and Demeler, B. (2007). Parsimonious Regularization using Genetic Algorithms Applied to the Analysis of Analytical Ultracentrifugation Experiments. GECCO Proceedings ACM. 978-1-59593-697-4/07/0007.
- Demeler B. and Brookes E. Monte Carlo analysis of sedimentation experiments. Colloid Polym Sci (2008) 286(2) 129-137
- Brookes, E. H., and B. Demeler. 2008. Parallel computational techniques for the analysis of sedimentation velocity experiments in UltraScan. Colloid Polym. Sci. 286:138-148.
- Schuck P, Demeler B. Direct Sedimentation Boundary Analysis of Interference Optical Data in Analytical Ultracentrifugation. Biophysical Journal, 76:2288-2296 (1999)
- Demeler, B Methods for the Design and Analysis of Sedimentation Velocity and Sedimentation Equilibrium Experiments with Proteins. Cur. Protoc. Prot. Sci. (2010) Chapter 7:Unit 7.13.
CENT-3453APP01.18
