Cytobank Cloud-Based Platform
Quickly summarizing high parameter data in intelligible, comprehensive figures can increase productivity. The compelling graphics offered by the platform enable unparalleled communication between clinical researchers, scientists and other collaboration partners.
- Analyze multiparameter cytometry data
- Visualize findings and produce high-impact graphics
- Archive data for ready access and compliance
- Collaborate with colleagues across disciplines and geographies
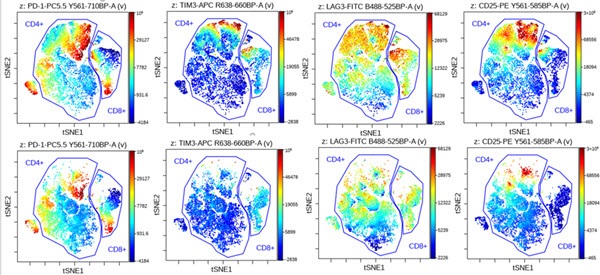
Activation Marker Expression Levels Using vi-SNE Algorithm. FCS files from representative wells from anti-CD3 and anti-CD28 stimulated and unstimulated PBMCs were uploaded into the Cytobank platform and dimensionality reduction using viSNE was conducted. Expression levels for each of the T cell activation markers is shown in color for both stimulated (top row) and unstimulated (bottom row) samples. CD4+ and CD8+ subsets were gated on the viSNE maps. Activated cells cluster at the top of the viSNE map (arrows) and the upregulation of the investigated markers is shown across all events.
Cytobank Data Management and Collaboration
Cytobank platform’s cloud -based capabilities allow scientists from around the globe to collaborate and dive deeper into large and complex data sets. Share and access data anytime, anywhere from any web-enabled device.
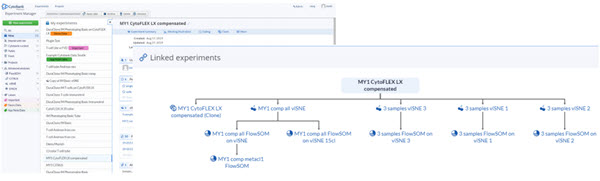
The Experiment Manager allows you to search your own experiments as well as experiments that have been shared with you. By organizing experiments in projects you can assign different levels of access. The Tree view clearly shows relationships between experiments and makes it easy to navigate to the advanced analysis you are looking for. In addition to preserving your cytometry experiments, Cytobank’s secure servers allow you to back up and associate related experimental data, including protocols, presentations and microscopy images.
